Network Diagrams are a graphical portrayal of the activities and events of a project. They show how each activity relates to others in the project, the sequence of activities, and the need to perform some tasks before others. Networks also facilitate the determination of the impact of early or late starts or finishes, provide information about the allocation of resources, and allow managers to do “what if” analyses. With this information, managers may view the status of the plan, analyze progress, and evaluate alternatives.
Definition: A project network diagram is a visualization that shows the activities, duration, and interdependencies of tasks within a project.
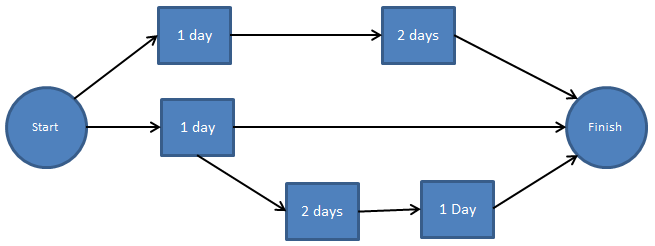
Figure: Arrow Diagramming Method Network Diagram
Why Understand a Network Diagram
You should become familiar with network diagrams, also referred to as the project schedule network diagram, whether you’re a project manager or a member of the project team. A project network diagram is a valuable tool that aids teams in visualizing the tasks that must be accomplished throughout the course of a project. Important context is also provided, such as task duration, sequencing, and dependency.
Types of Network Diagrams
Two types of network diagrams are used:
- Arrow Diagramming Method (ADM), also called “activity network diagram” or “activity on the arrow.”
- Precedence Diagramming Method (PDM), also called “node network” or “activity on node.”
Benefits of a Network Diagram
There are several benefits that program personnel can have utilizing a network diagram. A few benefits are:
- The project manager can track each element of a project and share status.
- Report progress to stakeholders
- Establishing project workflows
- Tracking dependencies
- Display any bottlenecks that pose a risk
Network Diagram Requirements
The following conditions must exist to develop a Network Diagram:[1]
- All program activities must be clearly defined, including identifiable start and completion points.
- A logic diagram showing the sequence and interrelationships of activities must be developed.
- The time to complete each activity must be estimated as accurately as possible.
Utilizing a Network Diagram
A network diagram is a useful tool for a project manager to plan and manage their projects more effectively. A network diagram can help a project manager to:
- Visualize the project’s workflow, meaning the order of project tasks and their relationship to other responsibilities.
- Identify the critical path, the longest sequence of tasks that must be completed on time for the project to finish on schedule.
- Estimate the duration of the project and create a realistic project schedule.
- Allocate resources more efficiently and focus on the most critical tasks.
- Monitor and control the project progress and identify any potential risks or issues.
Network Diagram Tools
A number of tools and techniques are useful in developing a network and logic diagram that reflects the desired activity sequencing. They include various network scheduling techniques that can be used to include: [1]
- Critical Chain Method (CCM)
- Critical Path Method (CPM)
- Precedence Diagram Method (PDM)
- Program Evaluation and Review Technique (PERT)
Computer Physical or Logical Network Diagram
A network diagram can be either physical or logical.
- Physical: Displays the hardware and cable configurations as well as the actual physical organization of the network’s constituent parts. Usually, the diagram provides a panoramic, or floorplan-like, overview of the network in its actual location.
- Logical: A logical network diagram provides an explanation of the information flow within a network.
Network Diagram Development
To create a network diagram, a project manager can use one of two methods: the arrow diagramming method (ADM) or the Precedence Diagramming Method (PDM). The ADM uses arrows to represent the project activities, with the tail of the arrow being its start and the point the finish. The PDM uses boxes to represent the project activities, with arrows showing their dependencies. Both methods can show the project tasks’ sequence, duration, and dependencies.
Accomplishing these things may require considerable effort and the involvement of people familiar with the overall project and those responsible for executing various groups of activities. This up-front effort provides an understanding of project requirements and early identification of potential problem areas. The eventual network diagram is usually developed into a Gantt Chart.
Many free software tools can help a project manager create and edit a network diagram, such as ProjectManager, Lucidchart, Creately, and SmartDraw. These tools can also integrate with other project management software, such as Microsoft Project, Asana, and Trello.
AcqLinks and References:
Updated: 11/29/2023
Rank: G14