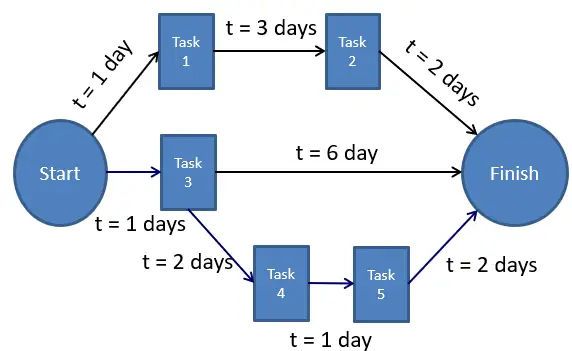
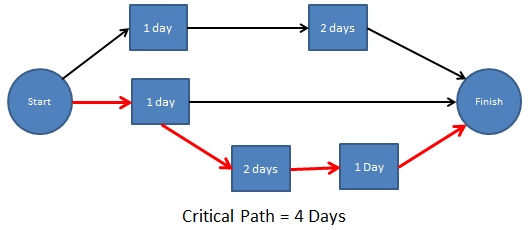
Program Evaluation and Review Technique (PERT) is a method used to examine the tasks in a schedule and determine a Critical Path Method variation (CPM). It analyzes the time required to complete each task and its associated dependencies to determine the minimum time to complete a project. It estimates the shortest possible time each activity will take, the most likely length of time, and the longest time that might be taken if the activity takes longer than expected. The US Navy developed the method in 1957 on the Polaris nuclear submarine project to evaluate the resources and time required to manage a project.
Definition: A Program Evaluation Review Technique (PERT) is used to depict a project’s timeline, estimate the duration of tasks, identify task dependencies, and determine the project’s critical path.
Purpose of Program Evaluation and Review Technique (PERT) Analysis
PERT Analysis informs Program Managers and project personnel on the project’s tasks and the estimated time required to complete each task. A Program Manager can estimate the minimum time required to complete the project using this information. The following are PERT’s primary characteristics:
- Helps in the creation of more realistic schedules and cost estimates
- Determine the Critical Path
- Provides a starting point for gathering crucial information for making decisions
- Serves as the foundation for all planning initiatives
- Aids management in selecting the most effective technique for utilizing resources
- Makes use of the time network analysis method
- Outlines the format for reporting data
- Aids management in determining the crucial components for timely project completion
Program Evaluation and Review Technique (PERT) Chart
A PERT chart is a picture of a project’s timeline that shows all of the separate tasks needed to finish the project. The PERT chart is how the PERT analysis is displayed and is often better than the Gantt chart for managing projects because it shows how tasks depend on each other. In a PERT chart, milestones are shown by numbered circles or rectangles, and jobs to be done are shown by straight lines with arrows at the end. The numbers and the direction of the lines show the correct order. Most of the time, the numbers increase by 10 at each milestone. This lets new jobs be added along the way without redrawing and numbering the whole chart.

How to Conduct a Program Evaluation and Review Technique (PERT)
Analysis
There are two main steps when determining the PERT Estimate. These two steps are:
- Step 1: Determine optimistic, pessimistic, and most likely estimates
- Step 2: Calculate PERT Estimate using the PERT Formula
Step 1: Determine optimistic, pessimistic, and most likely estimates
To conduct PERT Analysis, three-time estimates are obtained (optimistic, pessimistic, and most likely) for every activity along the Critical Path.
- Optimistic Time (O): the minimum possible time required to accomplish a task, assuming everything proceeds better than is normally expected.
- Pessimistic Time (P): the maximum possible time required to accomplish a task, assuming everything goes wrong (excluding major catastrophes).
- Most likely Time (M): the best estimate of the time required to accomplish a task, assuming everything proceeds as normal.

Step 2: Calculate PERT Estimate
After completing Step 1, use the (optimistic, pessimistic, and most likely) estimates in the formula below to calculate the PERT estimate for the project.
Formula: (P+4M+O)/6
Example: (8 + 4(14)+20)/6 = 14 Weeks
Critical Path
Definition Critical Path: The longest path of scheduled activities must be met to execute a project.
See: Critical Path Method

6 Steps to the Program Evaluation and Review Technique (PERT)
The six steps below provide a more detailed breakdown of the Program Evaluation and Review Technique (PERT). Follow the six steps below:
- Identify Activities: The first step is to determine what needs to be done to finish the job. Each task should be clear, measurable, and have a set amount of time. In a construction job, for example, activities could include laying the foundation, building the frame, installing the electricity, etc.
- Figure Out Dependencies: Figure out how the tasks depend on each other. Some things must be done in order, while others can work simultaneously. This step helps you determine how different tasks relate to each other and how they affect the project schedule.
- Estimate Durations: Guess how long it will take to finish each task. This can be done by talking to experts in the field, using data from the past, or using scientific methods. To figure out the whole project schedule, you need accurate estimates of how long things will take.
- Make a network diagram. Make a network diagram that shows how the tasks work together and how they depend on each other. This diagram usually uses nodes to show actions and arrows to show the flow and order. It helps you understand the key path and figure out which tasks can be moved up or pushed back without changing the date the project will be done.
- Find the critical path: Find the critical path, the longest chain of interdependent tasks that determines how long the whole job will take. Any delay in actions on the critical path will directly affect when the project is done. It helps set priorities and decide how to use resources.
- Schedule and Control: Make a schedule using the expected times and the results of the critical path analysis. The schedule shows how the job will be done and makes tracking and managing progress possible. Regular tracking, monitoring, and changes are needed to ensure the project stays on track and that any problems are dealt with quickly.
Understanding the PERT Chart
A PERT Chart represents the analysis or what is also called a Critical Path Nodal Diagram. The chart uses circles and/or rectangles to represent nodes (Events or Milestones in the schedule). These nodes are linked by lines/vectors between the key project tasks. These tasks must be performed in a specific order and depend on the task before them. The duration of the task is shown in the middle of the node. An example of a PERT Chart can be seen above.
Difference Between PERT Chart and Gantt Chart
Gantt charts date even further back than PERT charts and are graphical representations of project timelines. Presented as a horizontal bar chart, it depicts each project element’s start and finish dates, as well as their interdependencies. The two charts have comparable applications. Both are used to identify the essential tasks that must be performed to accomplish a project. Both are important for determining the required amount of time, money, and resources and can be used to track the completion of a project.
Advantages and Disadvantages of PERT Analysis
Understanding the advantages and disadvantages of utilizing PERT analysis will give program managers and project personnel a better understanding of the realities of their schedules. It takes an experienced program manager to truly utilize the benefits a PERT analysis can provide a project team.
- Advantages: Provides Program Managers information to evaluate time and resources on a project. It helps give them the necessary information to make informed decisions and set realistic schedules.
- Disadvantages: The analysis can be highly subjective and influenced by a few outspoken team members. It also required a lot of time to update the analysis as a program progresses continually. The charts might not convey the financial picture of a project.
Key Takeaways for Utilizing the Program Evaluation and Review Technique (PERT)
The Program Evaluation and Review Technique (PERT) is a way to look at the tasks needed to finish a project and show how they fit together. It is a tool for planning, coordinating, and keeping track of a project. The most important things for a project manager to know about PERT are:
- It can be used to determine what tasks need to be done in a project and how they depend on each other. This can help the project manager make a clear plan and schedule for the project.
- It can be used to find potential risks and bottlenecks in the project, so the project manager can take steps to reduce the risks and keep the project on track.
- It can track how a project is going and find any changes from how it was planned. This can help the project manager figure out what problems might arise and how to solve them.
- It can be used to share the project plan and schedule with team members and other important people. This lets everyone know what tasks need to be done and in what order they should be done.
Critical Path Method (CPM) and Program Evaluation and Review Technique (PERT)
Although the Critical Path Method (CPM) and PERT are conceptually similar, some significant differences exist mostly due to the type of projects best suited for each technique. PERT is better to use when there is much uncertainty and when control over time outweighs control over costs. PERT handles the uncertainty of the time required to complete an activity by developing three estimates and then computing an expected time using the beta distribution. CPM is better suited for well-defined projects and activities with little uncertainty, where accurate time and resource estimates can be made. The percentage of completion of the activity can be determined. [1]
| Critical Path Method | PERT |
| Built to handle tasks that can be planned, like buildings. | Made to handle tasks like technology development, which aren’t always predictable. |
| Deterministic, given that the lengths of activities are clear and known. | Probabilistic, with activity times, predicted as likely, optimistic, or pessimistic. |
| The diagrams look the same, but the jobs are shown in the boxes called “nodes.” | The diagram’s “nodes” are events, and the “arrows” between them are tasks. |
| Task-focused, and so better when you look at the jobs from the point of view of the people who do them. | It focuses on the action (milestones), which makes it an excellent way to look at the project from the customer’s point of view. |
| Comparison Table: CPM vs. PERT | |
History of Program Evaluation and Review Technique (PERT)
In 1958, the U.S. Navy introduced network scheduling techniques by developing PERT as a management control system for developing the Polaris missile program. PERT’s focus was to give managers the means to plan and control processes and activities so the project could be completed within the specified time period. The Polaris program involved 250 prime contractors, more than 9,000 subcontractors, and hundreds of thousands of tasks. [1]
PERT was introduced as an event-oriented, probabilistic technique to increase the Program Manager’s control in projects where time was the critical factor and time estimates were difficult to make with confidence. The events used in this technique represent the start and finish of the activities. PERT uses three-time estimates for each activity: optimistic, pessimistic, and most likely. An expected time is calculated based on a beta probability distribution for each activity from these estimates. [1]
AcqNotes Tutorial
AcqLinks and References:
Updated: 7/2/2023
Rank: G7
