A Schedule Network Analysis is a graphical representation of a schedule showing each sequenced activity and the time it takes to finish each one. It’s used to identify early and late start dates, as well as early and late finish dates, for the uncompleted portions of project schedule activities. This analysis also helps determine the Critical Path, What-if Analysis, and Schedule Compression. It’s usually represented in the form of a Gantt Chart or PERT Chart.
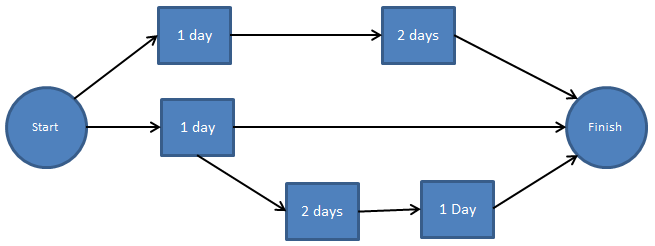
Figure: Network Diagram
Schedule Network Analysis provides:
- Activity sequencing
- Project length
- Completion date
- Critical Path
- Lead and Lag times
- Graphical representation of the entire project
- Possible slippage
- Possible what-if analysis
- Possible schedule crashing analysis
AcqLinks and References:
Updated: 6/19/2021
Rank; G1.8