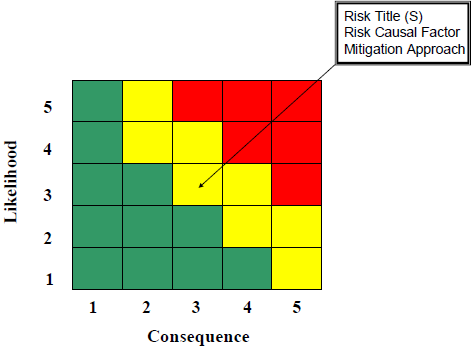
The Risk Assessment Matrix determines the level of risks identified within a program. The level of risk for each root cause is reported as low (green), moderate (yellow), or high (red).
Definition: A risk assessment matrix is a matrix that is used by program personnel during a risk assessment to define the overall level of risk (Low, Moderate, or High) by comparing likelihood and probability of occurrence.
Risk Assessment Matrix Goals
Risk assessment and reporting aims to provide the Program Manager and project personnel with a method for managing and communicating risk. The risk matrix provides a suitable and effective visual medium for communicating a program’s risks and severity.
DoD Risk Assessment Matrix Standard
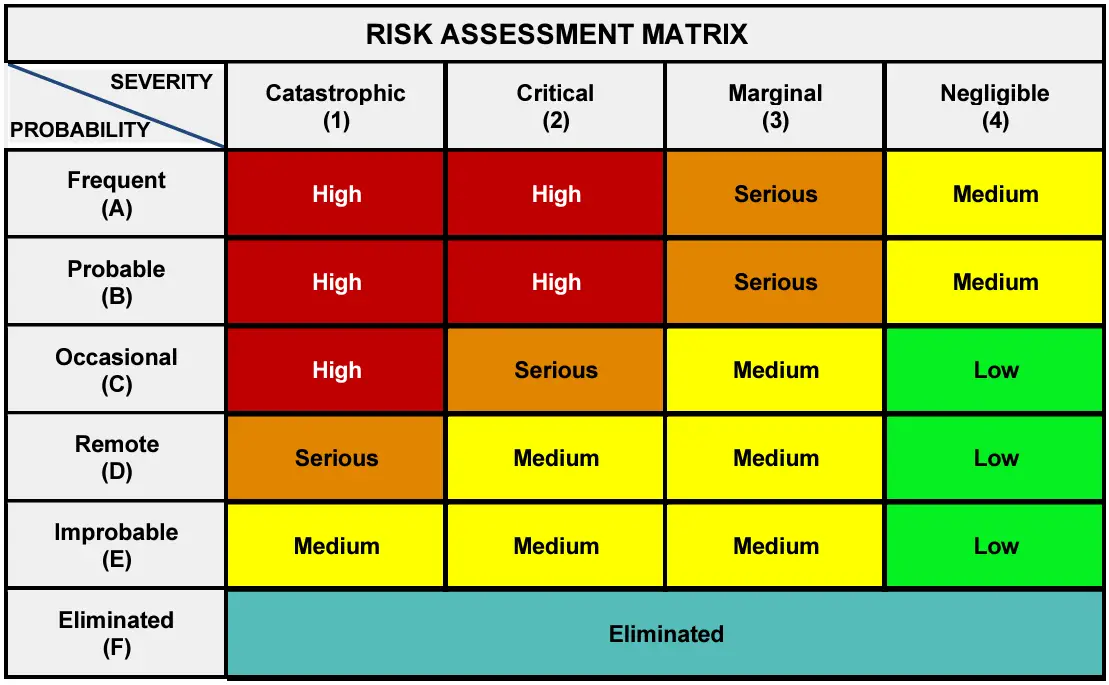
The risk assessment matrix that is shown above (5 x 5 version) was first defined by the US Department of Defense (DoD) MIL-STD-882 “System Safety” in 1984. However, the terminology is now Risk Assessment Matrix instead of Risk Reporting Matrix. The standard DoD format has changes and is show below.
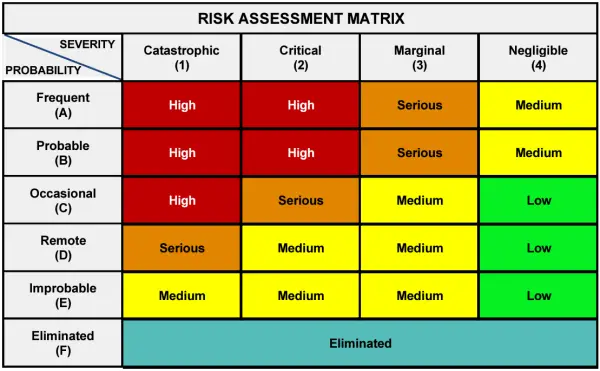 Table: DoD MIL-STD 882 Risk Assessment Matrix Format
Website: MIL-STD-882E “System Safety”
Risk Assessment Matrix Development Steps
Projects and organizations may have to make their own risk matrices or modify existing ones, even though there are standard matrices for particular situations. I will stick to the fundamental (5X5) risk assessment matrix for this example. There are three (3) steps associated with the Risk Assessment Matrix: [1]
- Step 1: Determine the Likelihood of Occurrence
- Step 2: Determine the Probability of Occurrence
- Step 3: Plot Results in Matrix
Step One: Determine the Likelihood of Occurrence
Determine the level of likelihood of a risk occurring by using established criteria. These criteria should be detailed in the Risk Management Plan. Example criteria are below. [1]
| Level | Likelihood | Probability of Occurrence |
| 1 | Not Likely | 10% |
| 2 | Low Likely | 30% |
| 3 | Likely | 50% |
| 4 | High Likely | 70% |
| 5 | Near Certain | 90% |
Step Two: Determine the Probability of Occurrence
Determine the level and types of consequences of each risk using established criteria: Risk Confidence & Probability. These criteria should be detailed in the Risk Management Plan. Example criteria are below. [1]
| Level | Technical Performance | Schedule | Cost |
| 1 | Minimal or no consequence to technical performance | Minimal or no impact | Minimal or no impact |
| 2 | Minor reductions in technical performance or Supportability can be tolerated with little or no impact on the program. | Able to meet key dates. Slip < * month(s) | Budget increase or unit production cost increases. < ** (1% of |
| 3 | A moderate reduction in technical performance or supportability with limited impact on program objectives | Minor schedule slip. Able to meet key milestones with no schedule float. Slip < * month(s) Sub-system slip > * month(s) plus available | Budget increase or unit production cost increase < ** (5% of Budget) |
| 4 | Significant degradation in technical performance or major shortfall in supportability; may jeopardize program success | Program critical path affected. Slip < * months | Budget increase or unit production cost increase < ** (10% of Budget) |
| 5 | Severe degradation in technical performance; Cannot meet KPP or key technical/supportability threshold; will jeopardize program success | Cannot meet key program milestones. Slip > * months | Exceeds APB threshold > ** (10% of Budget) |
Step Three: Plot Results in Matrix
Plot the results for each risk in the corresponding single square (as pointed to by the arrow) on the Risk Reporting Matrix. [1]
Risk Prioritization
Once a risk matrix has been developed, the program manager and project team can determine which risk takes priority. Determining this Risk Prioritization should consider the following:
- What is the likelihood and maximum of the cost, schedule, and performance impacts
- What is the cost associated with the risk
- What is the cost for risk mitigation activities
- What is the impact of the risk on the program
- What is the time frame and frequency of occurrence, and
- Is there an impact on other risks
AcqLinks and References:
- DoD Risk, Issue, and Opportunity Management Guide for Defense Acquisitions- Jan 2017
- (Old) DoD Risk Issue and Opportunity Management Guidance for Defense Acquisition Programs – June 2015
- [1] DoD Risk Management Guidebook – Section 4.0 – Aug 06 (Outdated)
- Risk Assessment Checklist
- Risk Assessment Worksheet and Management Plan
Updated: 3/3/2024
Rank: G1