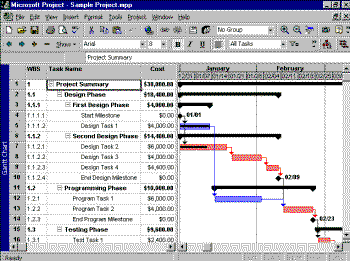
A Gantt chart is a schedule that shows the start/stop dates of a program’s individual activities. It uses symbols superimposed on a calendar to provide information about the original plan, the status of the activity, and any forecasted changes to the plan. There is no standard set of Gantt chart symbols.
The schedule is displayed as a series of horizontal bars representing the duration of activities. A Program Manager (PM) may show actual progress against the schedule by shading in each bar as the activity progresses or may use a colored bar that is parallel to the schedule bar. The Figure below shows a simple Gantt chart that illustrates activities involved in a project. This type of display can be useful for conveying information about the program to those involved in its review or those charged with its day-to-day management.
AcqLinks and References:
Updated: 6/20/2018