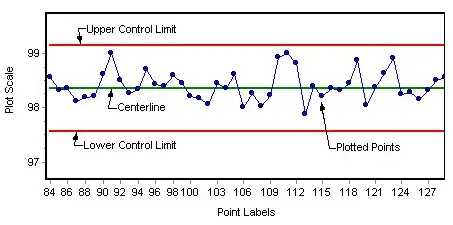
A Control Chart shows how a process varies over time while identifying special causes of variation and changes in performance. Similar to a run chart, it includes statistically generated upper and lower control limits. This type of chart prevents changing a process that is varying randomly within the control limits (no special cause present). Variables data in a control chart measure units in length, temperature, etc.
Purpose of Control Charts
The purpose of a control chart is to show Program Managers and project personnel if a process is varying over time which will allow them to correct those processes if needed.
Best Time to Use a Control Chart
Determining the best time to use a control chart is important. The following is a list of when it’s a good time to use a control chart.
- Analyzing ongoing processes by find anomalies
- Predicting the expected range of outcomes from a process
- Determining if a process is stable over time
- Analyzing patterns in a process
- Making a decision to fix a problem or change the process
When Not to Use a Control Chart
Unless the process question is clearly identified and the data supports an investigation of the process to control, control charts should not be the first tool used to analyze data.
Steps in Developing a Control Chart
Developing a control chart involves the following list of steps and activities:
- Step 1: Determining the type of chart needed,
- Step 2: Constructing the chart based upon the type of data,
- Step 3: Identifying and eliminating any special or assignable causes of variation,
- Step 4: Collecting 20 to 30 subgroups of data (consisting of two or more data points),
- Step 5: Determining the average and the range for each subgroup,
- Step 6: Determining the overall means (also called the grand average),
- Step 7: Determining the average value of the range,
- Step 8: Calculating the control limits and centerlines
- Step 9: Plotting the charts
- Step 10: Recalculating the control limits if there is a significant change in the process average or variability
Control Charts use two types of data:
- Attributes: A specific value or characteristic that is either present or absent and can be counted, but not measured. Attributes data requires making good/bad or go/no-go decisions and then counting this data, which is easier and less costly to obtain. There are typically four (4) types of attribute control charts:
- np chart: Charts the number of defective units in a subgroup if the sample size is constant.
- p chart: Charts the fraction or percent defective if the sample size varies.
- c chart: Charts the number of defects in a subgroup if the sample size is constant.
- u chart: Charts the number of defects per unit if the sample size varies.
- Variables: Data that requires measurements of an actual value rather than simple counting. Variables data needs measurements in units such as length, temperature, etc. The data is harder to obtain, but the charts better control a process. There are typically two (2) types of attribute control charts:
- XmR chart: Chart is used when there is only one observation in each time period.
- x-R chart: Charts to monitor a variable’s data when samples are collected at regular intervals from a business or industrial process.
Control Chart Negative Outcomes
Defective: A unit that fails to meet acceptance criteria due to one or more defects. Defective data is used when a quality characteristic of an item cannot be easily measured but can be classified as conforming or non-conforming. It involves the fraction, or percent of defectives in a sample, and are represented in either an np chart or an n chart.
Defect: A failure to meet one part of the acceptance criteria. Defect data is used when the quality of the item can be determined by the number of defects in the item or by counting the number of occurrences of some event per unit of time. The data can be shown in either the c chart or the u chart.
AcqLinks and References:
Updated: 7/11/2021
Rank: G27.2

